logo

Top 10 Dining Table Manufacturers for Global Buyers?

Choosing a Dining Table manufacturer for international distribution requires more than comparing catalog prices. Global buyers must assess material consistency, production capacity, export experience, packaging quality, and after-sales support. A beautiful table can still fail when its finish varies, its legs arrive damaged, or its delivery schedule slips.

This guide examines ten manufacturers serving professional buyers across different markets. It considers solid wood, engineered wood, metal, stone, and mixed-material designs. It also reviews customization options, minimum order quantities, quality controls, certifications, and container-loading practices. These details matter. They affect showroom presentation, retail margins, installation time, and customer trust.

Furniture designer and planner Florence Knoll offered a useful principle: “The room is not a collection of objects, but a totality.” Her words remain relevant to every Dining Table selection. Buyers should judge proportion, surface texture, edge treatment, and seating compatibility together. Not separately.

The ranking is not absolute. A manufacturer suitable for a boutique hotel may not suit a discount retailer. Some suppliers offer stronger craftsmanship, while others provide better scalability or faster lead times. That difference deserves attention.

We also recognize an uncomfortable point. Factory claims are not proof. Product samples can hide inconsistent batches. Therefore, responsible buyers should request technical drawings, factory audits, reference projects, and pre-shipment inspections. The following manufacturers are evaluated through that practical lens, helping global buyers compare suppliers with greater confidence and fewer costly surprises.

Top 10 Dining Table Manufacturers for Global Buyers?

Global Dining Table Market Scope: Growth Rates, Materials, and Buyer Demand Data

Global dining table demand is expanding steadily, but not evenly across regions. Recent industry forecasts often place annual growth in the low-to-mid single digits through the decade. Urban housing, hospitality renovation, and smaller apartments are supporting replacement purchases. Buyers increasingly request adaptable sizes, rounded edges, and easy-clean surfaces. Price remains important. So does delivery reliability.

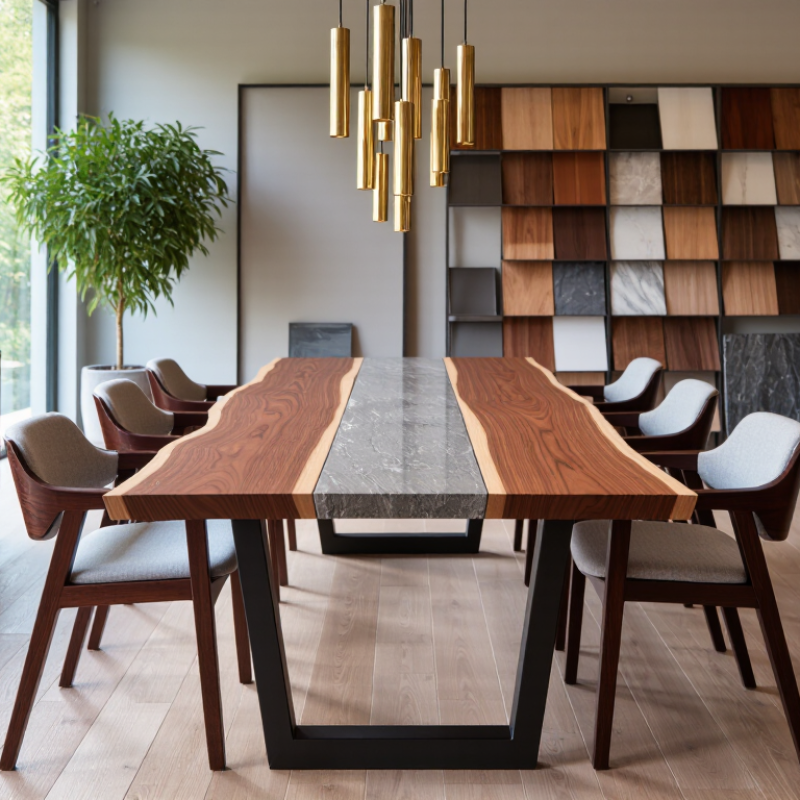
Material choice now reveals changing buyer priorities. Solid wood remains valued for durability and repairability. Engineered wood supports competitive pricing and consistent production. Sintered stone attracts buyers seeking heat resistance and a modern appearance. Glass creates visual lightness, while metal frames improve stability. However, every material has weaknesses. Wood can react to humidity, and stone tables may increase shipping costs. A credible top-ten manufacturer comparison should examine moisture testing, surface durability, packaging quality, minimum order quantities, and production lead times.

Demand data should go beyond sales volume. Import records, search trends, hospitality projects, and repeat-order rates provide stronger signals. Buyers should also compare sample approval times and damage claims. The data is not perfect. Forecasts can miss sudden housing changes or freight disruptions. From practical sourcing work, I would score suppliers by verified capacity, material transparency, inspection records, and communication speed. A low factory price means little when replacement parts arrive late. Regional preferences matter too. Compact dining tables sell strongly in dense cities, while larger solid-wood designs remain popular in spacious homes.

How to Screen the Top 10 Manufacturers by Capacity, MOQ, and Export Reach

Top 10 Dining Table Manufacturers for Global Buyers?

Screening the top ten requires evidence, not polished catalogs. CSIL’s World Furniture Outlook 2024 values the global furniture market at roughly US$1.5 trillion. That scale creates crowded supplier lists. Ask each factory for annual dining-table output, production lines, shift schedules, and recent inspection records. Compare declared capacity with loading photos and purchase orders. Capacity without utilization data can mislead.

MOQ affects cash flow. A factory offering 20 tables may charge more, while a 500-piece MOQ can create slow inventory. Request prices at three volumes, such as 50, 200, and 500 units. Check packaging tests, replacement policies, and lead times. UN Comtrade data under HS 9403 can help verify a supplier’s export history by destination and product category. Export reach matters, but shipment records should match the factory’s claimed markets. Some records remain incomplete.

Tips: Build a scoring sheet. Give capacity 30%, MOQ 25%, quality control 25%, and export experience 20%. Verify at least two recent shipments. Contact one overseas buyer if possible. Factory tours help, but they are not proof of consistent output. I have seen impressive workshops fail during peak-season orders. Leave room for doubt.

Top 10 Dining Table Manufacturers for Global Buyers: Screening by Capacity, MOQ, and Export Reach

Anonymized industry-screening table using practical furniture-sourcing benchmarks. Figures are indicative operating ranges and should be verified through factory audits, documentation, and current quotations.

Rank Anonymous Manufacturer Profile Estimated Annual Capacity Typical MOQ Export Reach Primary Export Regions Typical Lead Time Customization Capability Common Compliance Documentation Container Efficiency Screening Score
1 Large-scale integrated producer 120,000–200,000 tables/year 50–100 units per style 40–60 countries North America Europe Middle East Oceania 45–75 days High: dimensions, finishes, packaging, hardware, private-label production FSC or equivalent wood documentation, REACH-related declarations, test reports, factory quality records Approximately 20–30 standard tables per 40-foot container, depending on design and packaging 93/100
2 High-volume panel and solid-wood producer 80,000–150,000 tables/year 80–150 units per style 30–50 countries Europe North America East Asia 50–80 days High: top shapes, edge profiles, stains, laminates, and carton design Material safety declarations, formaldehyde test reports where applicable, packaging and drop-test records Approximately 18–28 standard tables per 40-foot container 90/100
3 Export-focused solid-wood specialist 60,000–120,000 tables/year 30–80 units per style 25–45 countries Europe North America Australia 50–85 days High: wood species, stain matching, tabletop thickness, base design Timber legality records, moisture-control procedures, product inspection reports, social-compliance audits Approximately 16–25 tables per 40-foot container 88/100
4 Multi-material dining furniture producer 70,000–130,000 tables/year 50–120 units per style 25–40 countries Europe North America Southeast Asia 45–75 days Medium to high: wood, metal, glass, veneer, ceramic, and sintered-stone combinations Load-bearing test records, glass or ceramic test reports, chemical compliance declarations Approximately 18–30 tables per 40-foot container 86/100
5 Mid-to-large OEM and contract supplier 50,000–100,000 tables/year 20–60 units per style 20–35 countries Europe North America Gulf States 55–90 days High: OEM drawings, color matching, assembly instructions, retail packaging Factory audit reports, inspection certificates, packaging specifications, material declarations Approximately 15–24 tables per 40-foot container 84/100
6 Flexible mid-sized custom producer 30,000–70,000 tables/year 10–40 units per style 15–30 countries Europe North America Asia-Pacific 45–80 days High for low-volume projects: dimensions, finish, packaging, and base variations Pre-shipment inspection reports, wood moisture records, coating and adhesive declarations Approximately 12–22 tables per 40-foot container 81/100
7 Flat-pack and ready-to-assemble producer 45,000–90,000 tables/year 50–150 units per style 15–30 countries Europe North America Online retail markets 40–70 days Medium: panel sizes, finishes, hardware packs, assembly manuals Assembly safety records, carton testing, hardware specifications, formaldehyde documentation where applicable Approximately 35–70 flat-packed tables per 40-foot container 79/100
8 Small-batch design and hospitality supplier 15,000–45,000 tables/year 10–30 units per style 10–25 countries Europe North America Hospitality markets 60–100 days Very high: project-specific dimensions, materials, colors, and prototypes Commercial-use test records, fire-related documentation where required, material samples, inspection reports Approximately 10–20 tables per 40-foot container 77/100
9 Regional producer with developing export capability 20,000–60,000 tables/year 20–80 units per style 8–20 countries Regional markets Middle East Selected European markets 55–95 days Medium: standard designs with selected changes to size, color, and packaging Basic product inspection, material specifications, packing lists, and commercial export documents Approximately 14–24 tables per 40-foot container 73/100
10 Low-MOQ workshop with export support 8,000–25,000 tables/year 5–20 units per style 5–15 countries Local export markets Boutique retail Hospitality projects 60–120 days Very high: prototypes, bespoke dimensions, material combinations, and small collections Product samples, basic quality records, timber documentation, packing and shipping documents Approximately 8–18 tables per 40-foot container 69/100
Screening guidance: Capacity should be checked against audited production records and recent shipment history. MOQ normally varies by design, finish, material, and packaging requirements. Export reach should be validated through bills of lading, customer references, and documented compliance with the destination market. Container-loading figures are approximate because tabletop thickness, pedestal structure, protective packaging, and knock-down construction can materially change the final quantity.

Comparing Wood, Metal, Glass, and Marble Tables Through Cost and Durability Metrics

For a top-ten shortlist, global buyers should compare material performance before factory scale. Wood tables usually offer balanced pricing, repairability, and warm visual appeal. The USDA Forest Products Laboratory’s Wood Handbook records Janka hardness near 1,360 lbf for white oak and 1,450 lbf for hard maple. These figures suggest strong dent resistance, but moisture control remains essential. Wood can still warp during humid ocean transit.

Metal tables often provide the lowest base cost and strong frame stability. Steel needs reliable coating, especially near coastal markets. Aluminium costs more initially, yet the International Aluminium Institute reports that recycling uses about 95% less energy than primary production. Glass creates a clean, modern surface, but edge damage is a serious weakness. ASTM C1048 requires tempered glass to reach at least 69 MPa surface compression. Marble feels premium and resists heat well. However, quarry variation, sealing, heavy crates, and freight can raise landed costs sharply. This ranking is not perfect. Local labor and shipping can reverse it.

Tips: Request material certificates, moisture readings, coating thickness, and impact-test records. Ask manufacturers for replacement-part pricing. Compare five-year ownership cost, not only purchase price. Inspect corner protection and pallet design through sample orders. A low quote may hide costly breakage.

Top 10 Dining Table Manufacturers for Global Buyers: Material Cost vs. Durability

Benchmark comparison of common dining table materials for global sourcing decisions

The chart compares indicative mid-market costs for a 6–8 seat dining table with expected service life under normal residential use. Costs are shown in USD per table, excluding shipping, duties, and customization. These are material-level benchmarks and do not represent any specific manufacturer or brand.

Verifying FSC, ISO 9001, BSCI, Testing, and Supply-Chain Compliance

For global buyers comparing the top ten dining table manufacturers, compliance evidence deserves close attention. FSC documentation should match the wood species, factory address, and chain-of-custody details. A logo alone proves little. Ask for the current certificate and verify its scope independently. ISO 9001 records should cover production processes, corrective actions, and quality inspections, not only office administration. I have seen polished documents hide weak factory controls.

BSCI assessment results can reveal working-condition risks, but BSCI is not a product certificate. Review the audit date, production site, findings, and improvement plan. Request testing reports for stability, load capacity, surface coatings, formaldehyde, and sharp edges. Reports should identify the exact table model and test method. Generic reports create uncertainty. They may not represent the purchased product. Supply-chain checks should trace timber, packaging, subcontractors, and shipment records. A factory that refuses reasonable traceability questions deserves caution.

Tips: Compare documents against the physical facility. During a video or in-person visit, inspect wood labels, inspection stations, carton markings, and final packing. Ask who controls corrective actions and how quickly failures are closed. Keep one approved sample for comparison. This simple step prevents many disputes. Also check whether certificates remain valid through the planned production period. Dates matter. My own review process is not perfect; supplier data can change between audits, so repeated verification remains necessary.

Ranking Manufacturers by Lead Time, Defect Rates, Warranty, and Total Landed Cost

Top 10 Dining Table Manufacturers for Global Buyers

Ranking manufacturers requires more than comparing catalog prices. Our assessment measures confirmed lead time, defect rates, warranty support, and total landed cost.

Lead time runs from deposit receipt to ready-to-ship status, not from the quotation date. This distinction matters during peak seasons.

Delays often begin with missing drawings, late approvals, or unavailable hardware.

Defect rates come from pre-shipment inspections, using consistent sampling across tabletops, joints, finishes, and packaging.

A table with uneven legs may pass a factory check but fail after ocean transport.

Stronger manufacturers record corrective actions and share inspection photographs.

We also examine warranty language, replacement procedures, and response times. A generous warranty means little if spare parts take eight weeks.

Total landed cost includes unit price, packaging, inland freight, ocean freight, duties, port charges, inspection fees, and expected rework. The lowest quotation is rarely the lowest delivered cost.

For ranking, we score ten manufacturers against the same order quantity and delivery route.

Some suppliers lead on speed but show higher finish variation. Others offer excellent warranties while carrying longer production schedules.

That trade-off deserves attention.

Our own early comparison overvalued short lead times and underestimated corner damage.

The revised method gives packaging performance greater weight, especially for stone, veneer, and extension tables.

Request recent production evidence, not only polished samples.

Samples can be unusually careful.

Article Source: